How to Enable Developer Tools in Chrome Step by Step
Our guide shows you exactly how to enable developer tools in Chrome on any device. You will learn keyboard shortcuts, menu paths, and pro tips to open DevTools fast. Whether you are a beginner or a seasoned coder, this walkthrough makes it simple to access Chrome’s powerful debugging features in just a few clicks.
Key Takeaways
- Multiple ways to open DevTools: You can use keyboard shortcuts, menu navigation, or right-click context menus to launch Chrome developer tools quickly.
- Works on every operating system: The process is nearly identical on Windows, Mac, and Chromebooks, with only small menu differences.
- Developer tools are disabled in some cases: Managed devices, kiosk mode, or enterprise policies can block access, and we show you how to fix that.
- Shortcuts save tons of time: Memorizing just one or two key combinations lets you open DevTools instantly during any browsing session.
- DevTools do much more than inspect code: You can debug JavaScript, analyze network requests, audit page performance, and simulate mobile devices.
- Troubleshooting is simple: Most issues with DevTools not opening can be resolved by clearing cache, updating Chrome, or checking system policies.
📑 Table of Contents
- What Are Chrome Developer Tools and Why Should You Care?
- How to Enable Developer Tools in Chrome on Windows
- How to Enable Developer Tools in Chrome on Mac
- Quick Shortcuts to Open Chrome DevTools
- What You Can Do with Chrome Developer Tools
- Troubleshooting: Developer Tools Not Working?
- Developer Tools Beyond the Basics
- Final Thoughts on Using Chrome DevTools
What Are Chrome Developer Tools and Why Should You Care?
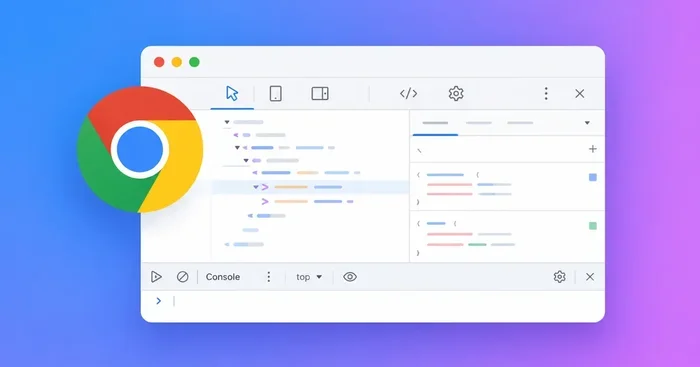
Chrome developer tools are a built-in set of web engineering tools. They live right inside your browser. You do not need to download anything extra. These tools let you look under the hood of any website. You can see the HTML, CSS, and JavaScript that make every page work.
So why should you care? Maybe you want to learn web development. Maybe you need to fix a broken website. Or perhaps you are just curious about how your favorite sites are built. Whatever your reason, how to enable developer tools in chrome is the first step. Once you open them, a whole world of information appears on your screen.
The tools are free. They are already inside your Chrome browser. You just need to know where to find them. This guide walks you through every method. You will be opening DevTools like a pro in no time.
Many people think developer tools are only for experts. That is not true at all. Beginners use them every day to learn and explore. Even designers use DevTools to check colors and spacing on web pages. The tools are for everyone.
How to Enable Developer Tools in Chrome on Windows
Opening DevTools on a Windows computer is very straightforward. There are several ways to do it. Pick whichever method feels most comfortable. We will walk through each one below.
Method 1: Use the Chrome Menu
Open your Chrome browser first. Look at the top-right corner. You will see three vertical dots. Click on them. A dropdown menu will appear. Move your cursor over “More Tools.” Then click “Developer Tools.” That is it. A panel will slide out from the side or bottom of your browser.
This method works every time. It is great if you prefer using menus over shortcuts. You will find this path on every Chrome window, no matter what page you are on.
Method 2: Use Keyboard Shortcuts
Keyboard shortcuts are the fastest way to open DevTools. On Windows, press F12 on your keyboard. You can also press Ctrl + Shift + I at the same time. Both shortcuts open the tools instantly.
If you prefer the console only, try Ctrl + Shift + J. This opens the JavaScript console directly. It skips the other panels and goes straight to the code output area.
These shortcuts work in almost every situation. Whether you are on a webpage, a blank tab, or even a new window, they will open DevTools right away.
Method 3: Right-Click and Inspect
This is probably the most popular method. Go to any webpage. Right-click anywhere on the page. Choose “Inspect” from the menu that appears. The DevTools panel will open right there.
What makes this method special is context. When you right-click on a specific element, DevTools highlights that element in the code view. You can immediately see the HTML and CSS for that exact part of the page. It is incredibly useful for quick debugging.
How to Enable Developer Tools in Chrome on Mac
The process on a Mac is very similar. There are only a few small differences. Let us go through each method so you can open DevTools on your Mac without any confusion.
Method 1: The Chrome Menu on Mac
Open Chrome on your Mac. Click “Chrome” in the top-left menu bar. Move down to “More Tools.” Then click “Developer Tools.” The panel will appear on your screen.
This path is almost the same as on Windows. The only difference is the top menu bar. On Mac, the Chrome menu sits at the top of the screen, not inside the browser window. Once you find it, the rest is easy.
Method 2: Mac Keyboard Shortcuts
On a Mac, press Command + Option + I to open DevTools. You can also press Command + Option + J for the console only. These shortcuts feel great once you memorize them.
Mac users can also use Fn + F12 on some keyboards. It depends on your keyboard model. Try it and see if it works for you.
Method 3: Right-Click Inspect on Mac
Right-click (or Control-click) anywhere on a webpage. Select “Inspect” from the menu. DevTools will open immediately. This method works exactly the same way as on Windows.
Mac trackpad users can also use a two-finger tap to open the context menu. It is a quick and easy alternative to right-clicking.
Quick Shortcuts to Open Chrome DevTools
Shortcuts are the fastest way to access developer tools. Here is a quick reference table so you can bookmark it and come back anytime.
| Action | Windows Shortcut | Mac Shortcut |
|---|---|---|
| Open DevTools | F12 or Ctrl + Shift + I | Cmd + Option + I |
| Open Console Only | Ctrl + Shift + J | Cmd + Option + J |
| Inspect Element | Right-click then Inspect | Right-click then Inspect |
| Toggle Dock Position | Ctrl + Shift + M | Cmd + Shift + M |
| Search Within Code | Ctrl + F | Cmd + F |
Print this table or save it to your browser bookmarks. You will use these shortcuts every single day once you start working with DevTools. They save so much time compared to clicking through menus.
Pro tip: You can also type chrome://inspect into your address bar and press Enter. This opens a special page that shows you all the pages available for inspection. It is handy when you are working with multiple tabs or remote devices.
What You Can Do with Chrome Developer Tools
Now that you know how to open them, let us talk about what you can actually do. Chrome developer tools are packed with features. Here are the most useful ones.
Inspect and Edit HTML and CSS
The Elements panel shows you the structure of any webpage. You can click on any HTML element and see its styles. Better yet, you can edit them live. Change a color, adjust a margin, or rewrite text. The page updates instantly. Nothing gets saved permanently, so you can experiment freely.
This feature is perfect for learning CSS. You can try different values and see the results in real time. It is like a playground for web design.
Debug JavaScript with the Console
The Console panel lets you run JavaScript commands directly. You can also see error messages from websites. When something breaks on a page, the console usually tells you why. It shows line numbers and error descriptions.
Developers use the console every day to test small code snippets. You can type a command and see the result immediately. It is one of the most powerful features in DevTools.
Analyze Network Requests
The Network panel tracks every request a webpage makes. You can see images, scripts, stylesheets, and API calls. Each request shows its load time, size, and status code.
This is incredibly useful for fixing slow websites. You can spot large files or failed requests quickly. If a page is not loading properly, the network tab usually has the answer.
Test Mobile Responsive Design
DevTools include a device toolbar. It lets you simulate different screen sizes. You can test how a website looks on a phone, tablet, or desktop. You can even change the network speed to see how the site performs on a slow connection.
Click the phone icon in the top-left corner of DevTools to toggle this mode. It is an essential tool for anyone who builds or designs websites.
Audit Page Performance
The Lighthouse panel gives you a performance score for any webpage. It checks loading speed, accessibility, best practices, and SEO. You get a detailed report with suggestions for improvement.
You can run these audits on any site, including your own. It is a great way to find areas where your website can perform better.
Troubleshooting: Developer Tools Not Working?
Sometimes DevTools will not open. This can be frustrating, but it is usually easy to fix. Here are the most common reasons and solutions.
DevTools Are Disabled by Your Organization
If you are using a work or school computer, your IT team may have blocked DevTools. This is common in managed environments. You will see an error message if this is the case.
To fix this, you may need to contact your administrator. On some systems, you can check Chrome policies by going to chrome://policy in your address bar. If DevTools are blocked there, you will need admin access to change it.
Chrome Is Out of Date
Older versions of Chrome sometimes have bugs with DevTools. Make sure your browser is up to date. Click the three dots in the top-right corner. Go to “Help” and then “About Google Chrome.” Chrome will check for updates and install them automatically.
Corrupted Cache or Profile
Sometimes your browser cache can cause issues. Try clearing your cache and cookies. Go to Settings, then Privacy and Security, then Clear Browsing Data. Select “Cached images and files” and click Clear Data.
If that does not work, try opening DevTools in a new Chrome profile. This helps you determine if the problem is with your current profile settings.
Conflicting Extensions
Some Chrome extensions can interfere with DevTools. Try disabling your extensions one by one to see if one is causing the problem. You can manage extensions by going to chrome://extensions in your address bar.
Another option is to open Chrome in Incognito mode. Extensions are disabled by default in Incognito. If DevTools work there, an extension is likely the culprit.
Keyboard Shortcuts Are Not Working
If your F12 key does nothing, check your keyboard settings. Some laptops require you to press Fn + F12. Others have function keys locked by default. Look for an Fn lock key on your keyboard and try toggling it.
You can also remap shortcuts in Chrome. Go to Settings, then Extensions, and look for a shortcut manager. This lets you customize which keys open DevTools.
Developer Tools Beyond the Basics
Once you are comfortable with the basics, you can explore more advanced features. DevTools have a lot of hidden gems that even experienced developers discover over time.
Use the Sources Panel for Breakpoints
The Sources panel lets you set breakpoints in JavaScript code. When the code hits a breakpoint, it pauses execution. You can then inspect variables and step through the code line by line. This is essential for finding bugs in complex scripts.
To set a breakpoint, open the Sources panel and find your JavaScript file. Click on the line number next to the code you want to pause at. Reload the page, and the code will stop right at that line.
Explore the Application Panel
The Application panel shows you stored data like cookies, local storage, and session storage. You can view and edit this data directly. It is very helpful when debugging login issues or tracking how websites store your information.
Monitor Performance with the Performance Panel
The Performance panel records everything happening on a webpage over time. You can see when the browser is repainting, reflowing, or running heavy scripts. This helps you identify performance bottlenecks that slow down your site.
Click the record button, interact with the page, then stop recording. The panel will show you a detailed timeline of every event. It is a powerful way to understand what is happening behind the scenes.
For those interested in building or maintaining websites, understanding these tools is essential. Whether you are a hobbyist learning web development or a professional building complex applications, knowing how to enable developer tools in chrome gives you a huge advantage. The tools are always there, ready to help you understand and improve the web.
You might also want to check out other diagnostic and maintenance tools that help keep your system running smoothly. For example, if you ever need to manage hardware tools or understand system costs, resources like adding oil to AC compressor can help with understanding equipment maintenance. Similarly, if you are curious about hose sizing for air compressors, it shows how different tools require specific knowledge to use effectively. And for those dealing with repair costs, learning about the labor cost to replace AC compressor in car or the cost to replace compressor in AC unit gives you practical insight into how understanding tools and systems goes hand in hand with knowing their real-world costs.
Final Thoughts on Using Chrome DevTools
Enabling developer tools in Chrome is simple, and the benefits are enormous. You now know multiple ways to open them. You understand the shortcuts for Windows and Mac. You have seen what you can do with the different panels. And you know how to troubleshoot common issues.
The best way to get better at using DevTools is practice. Open them on your favorite websites. Click around the different panels. Try editing some text or changing a color. Break things on purpose and then fix them. That is how real learning happens.
Remember, every expert was once a beginner. Do not be intimidated by the technical-looking interface. Start small. Learn one panel at a time. Soon you will be navigating DevTools like a pro. The skills you build here will serve you well in web development, debugging, and everyday browsing.
So go ahead. Open Chrome right now. Use one of the methods from this guide. Explore what is inside. You will be surprised by how much there is to discover. How to enable developer tools in Chrome is just the beginning of your journey into understanding how the web works.
Frequently Asked Questions
Can I use Chrome Developer Tools on a phone or tablet?
Yes, you can. On Android, open Chrome and tap the three dots. Go to “More Tools” and then “Developer Tools.” On iOS, the options are more limited, but you can use Safari Web Inspector on a Mac connected to your iPhone. Remote debugging is also possible with a USB cable.
Is it safe to use Chrome Developer Tools?
Absolutely. DevTools are built directly into Chrome by Google. They are completely safe and used by millions of developers every day. You cannot break your computer or browser by using them. Any changes you make only affect the current page and disappear when you refresh.
Do I need to know how to code to use Chrome DevTools?
Not at all. You can use DevTools to inspect any webpage without writing a single line of code. Even non-developers use them to check image sizes, view page sources, or debug loading issues. However, knowing some HTML and CSS makes the experience much more powerful.
Why can’t I find Developer Tools in my Chrome menu?
This usually happens on managed or enterprise computers. Your IT administrator may have disabled DevTools. You can check by going to chrome://policy in your address bar. If DevTools are blocked, you will need to contact your system administrator to enable them.
What is the difference between DevTools and browser extensions?
DevTools are built into Chrome and need no extra installation. Browser extensions are separate add-ons you download from the Chrome Web Store. DevTools give you access to the core rendering engine and debugging features. Extensions add extra features on top of that foundation.
Can I use Chrome DevTools to test my own website?
Yes, definitely. DevTools work on any website, including your own. You can use the Performance panel to measure load times, the Lighthouse panel to audit quality, and the Console to debug errors. It is one of the best free tools available for website testing and optimization.
=== CONCLUSION ===
How to enable developer tools in Chrome is a skill that opens up a world of possibilities. Whether you are debugging a website, learning to code, or just curious about how pages work, DevTools have you covered. You now know the menu method, the right-click method, and all the important keyboard shortcuts for both Windows and Mac.
Remember the key shortcuts: F12 and Ctrl + Shift + I on Windows, Command + Option + I on Mac. These will become second nature with practice. The tools inside DevTools, from the Elements panel to the Network tab, give you deep insight into every website you visit.
If you run into any issues, the troubleshooting section has you covered. Clear your cache, update Chrome, or check your organization policies. Most problems have simple solutions. Start exploring today and see what you can discover. Happy debugging.