how to see developer tools in safari on mac and iphone
Finding developer tools in Safari is simple once you know where to look. On a Mac, you just need to enable the Develop menu in Safari preferences. On an iPhone, you can use Web Inspector by connecting to a Mac. This guide covers every method to access Safari developer tools on both devices, so you can inspect elements, debug code, and analyze network activity with ease.
If you have ever wanted to peek behind the curtain of a website, how to see developer tools in Safari is a skill worth learning. Safari comes with a built-in set of developer tools that let you inspect HTML, debug JavaScript, and analyze page performance. Whether you are a web developer, a designer, or just curious about how websites work, these tools are incredibly powerful.
The process differs slightly depending on whether you are on a Mac or an iPhone. On a Mac, you mostly just need to flip a setting. On an iPhone, you need to pair it with a Mac first. This guide walks you through every step in plain language. By the end, you will know exactly how to open and use Safari Web Inspector on any Apple device.
Let us start with the Mac, since that is the most common setup and the easiest place to begin.
Key Takeaways
- Enable the Develop menu on Mac: A quick settings change unlocks powerful Safari debugging tools.
- Use Web Inspector on iPhone: Pair your iPhone with a Mac to inspect and debug mobile web pages.
- Keyboard shortcuts save time: Cmd+Option+I opens Safari developer tools instantly on Mac.
- Safari Technology Preview offers extras: Get early access to new web development features.
- Responsive Design Mode helps testing: Simulate different screen sizes right inside Safari.
- Console and Network tabs are essential: Use them to catch JavaScript errors and monitor page loads.
📑 Table of Contents
How to See Developer Tools in Safari on Mac
Opening developer tools in Safari on a Mac is a straightforward process. You just need to enable the Develop menu first. Once that menu is active, accessing the tools takes just a few clicks or a single keyboard shortcut.
Step 1: Enable the Develop Menu
By default, Safari hides the Develop menu. This keeps the browsing experience clean for everyday users. But if you want to do any kind of web development or inspection, you need to turn it on.
- Open Safari on your Mac.
- Click on “Safari” in the top-left menu bar.
- Select “Settings” (or “Preferences” on older macOS versions).
- Click on the “Advanced” tab.
- Check the box that says “Show Develop menu in menu bar.”
That is it. You should now see a “Develop” option in your top menu bar. This gives you access to a wide range of Safari debugging tools right from the menu.
Step 2: Open the Web Inspector
Now that the Develop menu is visible, opening the tools is easy. There are three ways to do it:
- Keyboard shortcut: Press Cmd + Option + I. This is the fastest method and the one most developers use daily.
- Menu method: Click Develop in the top menu bar, then select “Show Web Inspector.”
- Right-click method: Right-click anywhere on a webpage and choose “Inspect Element.” This opens the inspector directly on the element you clicked.
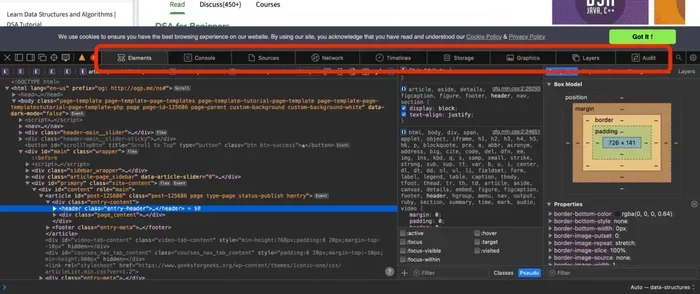
Each method opens the Web Inspector panel, which contains several tabs for different tasks. Let us look at what you can do inside this panel.
Key Tabs Inside Safari Web Inspector
The Web Inspector has multiple tabs, each serving a different purpose. Understanding what each tab does helps you get the most out of Safari developer tools.
| Tab | What It Does |
|---|---|
| Elements | Shows the HTML and CSS of the page. Lets you edit and inspect individual elements. |
| Console | Displays JavaScript errors, warnings, and logs. Great for debugging code. |
| Network | Shows all network requests. Helps you see load times and failed requests. |
| Sources | Lets you view and debug JavaScript source files directly. |
| Storage | Displays cookies, local storage, and session storage data. |
| Timelines | Records performance data to help you find slow-loading elements. |
The Elements tab is probably the one you will use most often. It lets you see the structure of any webpage and even make live changes to the HTML and CSS. This is incredibly useful when you want to test design changes before updating actual code.
How to See Developer Tools in Safari on iPhone
Using Safari developer tools on an iPhone requires a Mac because the Web Inspector runs on the desktop side. You connect your iPhone to your Mac, and then you can inspect and debug any webpage open on your iPhone. This is especially helpful for testing how websites look and behave on mobile devices.
Step 1: Enable Web Inspector on Your iPhone
Before you can use Web Inspector, you need to turn it on in your iPhone settings.
- Open the Settings app on your iPhone.
- Scroll down and tap “Safari.”
- Scroll to the bottom and tap “Advanced.”
- Toggle on “Web Inspector.”
Once Web Inspector is enabled, your iPhone is ready to be paired with your Mac for debugging.
Step 2: Connect iPhone to Mac
Use a USB cable to connect your iPhone to your Mac. Make sure your Mac trusts the iPhone connection. You may need to unlock your iPhone and tap “Trust” when prompted.
Step 3: Open Web Inspector on Mac
With your iPhone connected, open Safari on your Mac and navigate to the webpage you want to inspect. Then follow these steps:
- Open the Develop menu in the Mac menu bar.
- You should see your iPhone listed under “Web Inspector.”
- Hover over your iPhone name to see a list of open tabs.
- Click on the tab you want to inspect.
The Web Inspector will open on your Mac, showing the content from your iPhone in real time. You can now inspect elements, debug JavaScript, and analyze network activity just as you would on the desktop.
Tip: Make sure both your Mac and iPhone are signed into the same Apple ID and are on the same Wi-Fi network for the best experience.
Useful Safari Developer Tools Features
Once you know how to open Safari developer tools, it is worth exploring the features that make them so useful. Here are some of the most practical capabilities.
Inspect and Edit Elements
The Elements panel lets you click on any part of a webpage and see the HTML and CSS behind it. You can also make temporary changes to see how they look. This is perfect for testing color changes, font sizes, or layout adjustments without touching the actual website code.
Debug JavaScript with the Console
The Console tab is a playground for JavaScript. You can type commands directly into it and see results instantly. When a webpage has errors, they show up here in red text. You can also use console.log() statements in your code to print values and track down bugs.
Monitor Network Activity
The Network tab records every request a webpage makes. This includes images, scripts, stylesheets, and API calls. You can see how long each request takes and identify anything that is slowing down the page. This is one of the most powerful Safari debugging tools for performance optimization.
Use Responsive Design Mode
Safari includes a responsive design mode that lets you test how a website looks at different screen sizes. You can simulate iPhone, iPad, and desktop viewports right from the Web Inspector. This is invaluable for mobile web development and cross-device testing.
View Storage Data
The Storage panel shows you all the cookies, local storage, and session storage data a website has saved. This is helpful when debugging login issues or understanding how a site tracks user data.
Safari Technology Preview: An Extra Developer Toolkit
If you want even more power, consider downloading Safari Technology Preview. This is a free version of Safari from Apple that includes the latest web developer features before they reach the regular release. It is a great way to test new web development APIs and tools.
You can download Safari Technology Preview from Apple’s developer website. It installs alongside your regular Safari and does not interfere with your daily browsing. The developer tools in Technology Preview work the same way as the standard Safari tools, but with extra features added first.
Common Mistakes to Avoid
Even experienced users sometimes run into trouble when using Safari Web Inspector. Here are a few common mistakes and how to avoid them.
- Forgetting to enable the Develop menu: Without this step, you will not see the Develop menu or the Web Inspector option. Always check this first if you cannot find the tools.
- Not enabling Web Inspector on iPhone: If your iPhone does not show up under the Develop menu on Mac, go back to iPhone Settings and make sure Web Inspector is toggled on.
- Using an outdated macOS version: Some developer features require newer versions of macOS. Keep your system updated for the best experience.
- Ignoring the Console: Many users focus on the Elements tab and overlook the Console. The Console is where you will find many hidden errors that affect page behavior.
- Not clearing cache when testing: Sometimes old cached files interfere with your debugging. Clear your cache or use private browsing for more accurate results.
Quick Tips for Better Debugging
Here are some quick tips that will make your Safari developer workflow smoother and more efficient.
- Use Cmd + Option + I to open Web Inspector in under a second.
- Press Cmd + Shift + C to directly enter element selection mode from anywhere on the page.
- Use the Network tab with the “Preserve log” option checked to keep network data even when the page reloads.
- Right-click any element in the Elements panel and select “Show in Console” to quickly reference it in JavaScript.
- Use the responsive design toolbar to test multiple device sizes without needing physical devices.
- Bookmark the Web Inspector for quick access when you need to return to it on a complex page.
Why Safari Developer Tools Matter
Understanding how to see developer tools in Safari opens up a world of possibilities. You can learn how your favorite websites are built, debug issues on your own projects, and ensure your sites work well across Apple devices. Safari’s developer tools are free, built right into the browser, and surprisingly powerful.
Whether you are a beginner learning web development or a seasoned professional testing on Apple platforms, these tools deserve a place in your workflow. They are especially useful given the large number of users on Safari and iOS devices. If you want to build websites that work well for everyone, mastering Safari’s developer tools is a smart move.
Start with the basics: enable the Develop menu, open Web Inspector, and explore the different tabs. As you get comfortable, dive into the Console, Network, and Elements panels. The more you use them, the more powerful they become.
Final Thoughts
Learning how to see developer tools in Safari on both Mac and iPhone is easier than most people think. With just a few settings changes, you unlock a full suite of debugging and inspection tools. These tools help you build better websites, fix issues faster, and understand how the web works under the hood.
Remember the key steps: enable the Develop menu on Mac, toggle Web Inspector on your iPhone, and use the keyboard shortcuts to speed up your workflow. The more you practice, the more natural it becomes. Soon, opening Safari developer tools will be second nature.
So go ahead, enable those tools, and start exploring the web like a developer. You might be surprised at what you discover.
Frequently Asked Questions
Can I use Safari developer tools on an iPhone without a Mac?
No, you need a Mac to use the full Web Inspector on iPhone. Apple requires you to connect your iPhone to a Mac via USB or Wi-Fi to access the debugging tools. However, you can use some basic tools like the responsive design mode directly on the iPhone through Safari Technology Preview.
What is the shortcut to open Safari developer tools on Mac?
The fastest shortcut is Cmd + Option + I. This opens the Web Inspector instantly. You can also use Cmd + Option + C to open the Console directly. These shortcuts work once you have enabled the Develop menu in Safari settings.
Why can’t I see my iPhone under the Develop menu on Mac?
This usually happens when Web Inspector is not enabled on your iPhone. Go to Settings, tap Safari, then Advanced, and make sure Web Inspector is turned on. Also check that your iPhone is connected to the same Wi-Fi network as your Mac and that you have trusted the computer connection.
Is Safari Technology Preview safe to use alongside regular Safari?
Yes, it is completely safe. Safari Technology Preview installs as a separate application and does not affect your regular Safari browsing or settings. It is designed for developers who want to test new web features before they are released in the standard Safari version.
Can I edit website code using Safari developer tools?
Yes, you can make temporary edits to HTML and CSS using the Elements panel. These changes only affect what you see in your browser and do not change the actual website. This is a great way to test design ideas or troubleshoot layout issues before updating the real code.
What should I do if Safari developer tools are not working properly?
First, make sure your Safari and macOS are fully updated. Restart both your Mac and iPhone if needed. Try disabling and re-enabling the Develop menu and Web Inspector settings. If the issue persists, resetting Safari settings or clearing the browser cache often resolves the problem.
=== CONCLUSION ===
Knowing how to access Safari developer tools on both Mac and iPhone is a valuable skill for anyone interested in web development or website debugging. The process is simple, the tools are powerful, and they come built into your Apple devices at no extra cost. From enabling the Develop menu to using Web Inspector on your iPhone, this guide has covered everything you need to get started.
Start with the basics, explore the different panels, and build your confidence over time. Whether you are inspecting elements, debugging JavaScript, or monitoring network requests, Safari Web Inspector gives you everything you need. Open Safari today, enable the Develop menu, and start exploring the web from a developer’s perspective.