What Valuable Insights Can You Gather Using Analytics Tools
Analytics tools unlock powerful data insights that help businesses understand customer behavior, track performance, and make smarter decisions. You can uncover trends in user engagement, identify growth opportunities, and optimize every part of your operations. This guide walks you through the most valuable insights you can gather and how to use them effectively.
Every day, businesses generate massive amounts of data. Website visits, app usage, purchases, email opens, social media interactions — the list goes on. But raw data alone means nothing unless you know how to read it. That is where analytics tools come in. They take all that information and turn it into actionable data insights that can transform the way you run your business.
Whether you run a small online shop or manage a large enterprise, understanding what your analytics tools can reveal is a game changer. You will learn who your customers are, what they want, and how to give it to them better than anyone else. In this article, we will explore the most valuable insights you can gather using analytics tools and show you exactly how to put them to work.
The beauty of modern data analysis is that you do not need to be a tech expert to benefit from it. The right tools break down complex numbers into simple, visual reports. You can spot patterns, catch problems early, and find new ways to grow. Let us dive into the specific insights that can make a real difference for your business.
Key Takeaways
- Understand User Behavior: Analytics tools reveal how visitors interact with your website or app, showing exactly where they click, scroll, and drop off.
- Track Key Performance Indicators: You can monitor KPIs like conversion rates, bounce rates, and session duration to measure real progress.
- Identify Growth Opportunities: Data highlights untapped audiences, high-performing content, and areas ripe for improvement.
- Make Data-Driven Decisions: Stop guessing and start using real numbers to guide your marketing, product, and business strategies.
- Segment Your Audience: Analytics let you group users by behavior, location, and demographics for personalized experiences.
- Predict Future Trends: Advanced tools use predictive analytics to forecast what your customers will do next.
- Boost ROI Across Channels: Marketing analytics show you which channels deliver the best return on investment.
📑 Table of Contents
- Understanding User Behavior and Engagement
- Tracking Key Performance Indicators and Goals
- Audience Segmentation and Demographics
- Marketing Analytics and Channel Performance
- Predictive Analytics and Future Insights
- Data Visualization and Reporting Dashboards
- Turning Insights Into Action
- Common Mistakes to Avoid When Using Analytics Tools
- Conclusion
Understanding User Behavior and Engagement
One of the biggest benefits of analytics tools is the ability to see exactly how users interact with your digital platforms. You are not guessing anymore. You are watching real people navigate your website, use your app, or engage with your content. This level of visibility opens up a world of understanding.
How Users Move Through Your Site
Website analytics show you the paths visitors take from the moment they land on your page. You can see which pages they visit first, where they click, and where they leave. This is called the customer journey, and it is incredibly valuable. When you understand the journey, you can remove friction points and guide users toward the actions you want them to take.
For example, if you notice that most visitors leave your site from the pricing page, that tells you something important. Maybe your pricing is confusing. Maybe it is too high. Maybe visitors need more social proof before they commit. Whatever the reason, analytics tools help you pinpoint the issue so you can fix it.
Engagement Metrics That Matter
Not all interactions are created equal. Engagement metrics go beyond simple page views. They measure things like:
- Session duration — how long visitors stay on your site
- Pages per session — how many pages they view in one visit
- Bounce rate — the percentage of visitors who leave after viewing only one page
- Scroll depth — how far down the page users scroll
- Click-through rate — how often users click on links or buttons
These metrics paint a clear picture of whether your content is resonating with your audience. A high bounce rate on your blog posts, for instance, might mean your headlines are misleading or your content does not match what readers expected. A low scroll depth could indicate that your page layout needs work.
Quick Tip: Do not just look at numbers in isolation. Compare metrics across different pages and time periods. This gives you context and helps you spot trends that a single number would never reveal.
Tracking Key Performance Indicators and Goals
Every business has goals. Maybe you want to increase sales, grow your email list, or get more people to sign up for a free trial. Analytics tools let you track key performance indicators (KPIs) that directly measure your progress toward those goals.
Conversion Tracking
Conversion tracking is one of the most powerful features of any analytics platform. It shows you exactly how many visitors complete a desired action, whether that is making a purchase, filling out a form, or downloading a resource. When you know your conversion rate, you can calculate the real return on your marketing efforts.
Here is a simple example. If your website gets 10,000 visitors per month and 50 of them make a purchase, your conversion rate is 0.5%. Now, if you optimize your site based on data insights and your conversion rate jumps to 1%, you just doubled your sales without getting a single new visitor. That is the power of tracking the right metrics.
Funnel Analysis
A funnel analysis breaks down the steps users take before completing a goal. Imagine a funnel with wide steps at the top and narrow steps at the bottom. At the top, you have hundreds of visitors. By the bottom, you have a much smaller number of customers. Analytics tools show you where people drop off in the funnel so you can focus your efforts on fixing those weak points.
Common drop-off points include:
- Landing page to product page
- Product page to cart
- Cart to checkout
- Checkout to payment confirmation
If you notice that most people abandon their carts, you might need to simplify your checkout process or offer more payment options. The data tells the story — you just need to read it.
Audience Segmentation and Demographics
Not all visitors are the same. Analytics tools let you break your audience into smaller groups based on shared characteristics. This process, called audience segmentation, helps you understand different types of users and tailor your approach to each group.
Who Is Visiting Your Site?
Demographic data gives you a snapshot of your audience. You can learn about their:
- Age and gender
- Location and language
- Device type — mobile, tablet, or desktop
- Interests and hobbies
- New vs. returning visitors
This information is incredibly useful for shaping your marketing messages and content strategy. If you discover that 70% of your traffic comes from mobile users, you know your site needs to be mobile-friendly. If most of your visitors are in a specific region, you can localize your campaigns to speak directly to them.
Behavior-Based Segmentation
Beyond demographics, analytics tools let you segment users by what they actually do on your site. You can create groups like:
- Users who visited your pricing page but did not convert
- Users who abandoned their shopping cart
- Users who read three or more blog posts in one session
- Users who came from a specific social media platform
Each of these segments has different needs and motivations. By understanding their behavior, you can create targeted campaigns, personalized emails, and customized landing pages that resonate with each group. This level of personalization leads to better engagement and higher conversions.
Marketing Analytics and Channel Performance
Running a business means wearing many hats, and marketing is one of the biggest ones. Marketing analytics give you a clear picture of which channels are working and which ones are wasting your budget. Instead of spreading your money evenly across every platform, you can focus on what actually delivers results.
Traffic Source Analysis
Traffic source analysis tells you where your visitors are coming from. The main categories include:
- Organic search — people who found you through Google or Bing
- Direct traffic — people who typed your URL directly
- Referral traffic — people who clicked a link from another website
- Social media — people who came from platforms like Facebook, Instagram, or Twitter
- Paid campaigns — people who clicked on your ads
- Email marketing — people who clicked a link in your newsletter
When you see which sources bring the most traffic and the highest-quality visitors, you can double down on those channels. If organic search drives 60% of your conversions but social media only drives 5%, you know where to invest your time and money.
Return on Investment (ROI) Tracking
Every dollar you spend on marketing should earn you a return. Analytics tools help you calculate the ROI for each campaign, channel, and tactic. By comparing the cost of acquisition to the revenue generated, you can see which efforts are profitable and which need to be adjusted or cut.
This is especially important for small businesses with limited budgets. When every dollar counts, you need to know exactly where it is making the biggest impact. Data-driven decisions remove the guesswork and give you confidence in your spending choices.
Predictive Analytics and Future Insights
The most advanced analytics tools do not just tell you what happened — they help you predict what will happen next. This is called predictive analytics, and it is one of the most exciting developments in the world of business intelligence.
Forecasting Customer Behavior
By analyzing historical data, predictive models can identify patterns that suggest future actions. For example, you might notice that customers who buy product A often purchase product B within 30 days. Armed with this data insight, you can create targeted cross-sell campaigns that feel natural and helpful rather than pushy.
Predictive analytics can also help you forecast demand. If you run an e-commerce store, knowing which products are likely to trend in the coming weeks lets you stock up in advance and avoid missed sales. You can also predict customer churn — identifying which customers are at risk of leaving so you can reach out with a retention offer before it is too late.
Real-Time Data for Quick Decisions
Many analytics platforms now offer real-time data dashboards. This means you can see what is happening on your site right now, not yesterday or last week. Real-time insights are especially useful during:
- Product launches and promotions
- Email campaign sends
- Social media campaigns
- Flash sales or limited-time offers
When you can see results as they happen, you can make quick adjustments. If a promotion is underperforming, you can pivot immediately instead of waiting for a weekly report to tell you the bad news.
Data Visualization and Reporting Dashboards
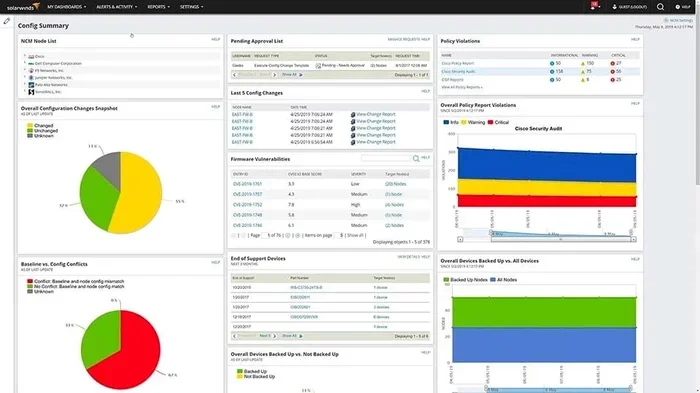
Raw numbers can be overwhelming. That is why data visualization is such a critical part of modern analytics. Charts, graphs, heat maps, and dashboards turn complex data into visual stories that anyone can understand.
Reporting dashboards pull together your most important metrics into a single, easy-to-read view. Instead of logging into five different tools and digging through spreadsheets, you can see everything you need at a glance. This saves time and makes it easier to share insights with your team or stakeholders.
Some of the most popular analytics tools for visualization include Google Analytics, Tableau, Power BI, and Mixpanel. Each platform has its strengths, so the best choice depends on your specific needs and budget. The key is to find a tool that presents your performance metrics in a way that is clear, accurate, and actionable.
Expert Insight: The best dashboards are not the ones with the most data — they are the ones with the most relevant data. Start with a few key metrics that directly align with your business goals, and build from there. Too much information can actually paralyze decision-making instead of enabling it.
Even in industries like manufacturing and industrial equipment, analytics tools are becoming essential. For businesses that rely on compressed air systems, for example, monitoring equipment performance and maintenance schedules through data can prevent costly downtime. In fact, understanding the right equipment specifications, such as what size hose to use with air compressor systems, is a practical example of how data-driven decisions improve operations across different sectors. You can read more about optimizing your air compressor setup at what size hose to use with air compressor configurations.
Turning Insights Into Action
Gathering insights is only half the battle. The real value comes from what you do with them. Every piece of data you collect should lead to a concrete action. Here is how to make sure your analytics insights drive real results.
Set Clear Goals Before You Analyze
Before you dive into your analytics platform, define what you want to learn. Are you trying to reduce your bounce rate? Increase conversions? Understand your audience better? Having a clear goal keeps your analysis focused and prevents you from getting lost in irrelevant data.
Create an Action Plan for Each Insight
When you discover something interesting in your data, do not just note it — act on it. Create a simple plan that includes:
- The insight you discovered
- The action you will take
- The timeline for implementation
- The metric you will track to measure success
This approach ensures that your data analysis efforts lead to real improvements, not just interesting observations.
Review and Iterate Regularly
Analytics is not a one-time project. It is an ongoing process. Make it a habit to review your performance metrics weekly or monthly. Look for new trends, test different strategies, and refine your approach based on what the data tells you. The businesses that win are the ones that stay curious and keep iterating.
Common Mistakes to Avoid When Using Analytics Tools
Even with the best tools, it is easy to fall into traps that undermine your data insights. Here are a few common mistakes to watch out for:
- Vanity metrics obsession: Focusing on numbers that look impressive but do not actually drive business results, like total page views instead of conversion rate.
- Ignoring context: Looking at a metric without understanding the bigger picture. A spike in traffic might look great, but if it came from a low-quality source, it means nothing.
- Analysis paralysis: Spending too much time analyzing data and not enough time acting on it. At some point, you need to make a decision and move forward.
- Setting and forgetting: Installing your tracking tools and never reviewing the data. Analytics only works when you actively engage with it.
- Ignoring data quality: If your tracking setup is broken or incomplete, your data insights will be unreliable. Always verify that your analytics implementation is working correctly.
Avoiding these pitfalls will help you get more value from your analytics tools and make better data-driven decisions every day.
Conclusion
The insights you can gather using analytics tools are truly remarkable. From understanding user behavior and tracking key performance indicators to predicting future trends and measuring marketing ROI, these tools give you a superpower — the ability to see exactly what is working, what is not, and what to do about it.
Data analysis is no longer a luxury reserved for large corporations. Today, businesses of every size can harness the power of analytics platforms to make smarter decisions, improve customer experiences, and drive growth. The key is to start small, stay consistent, and always let the data guide your actions.
Remember, the goal is not to collect more data — it is to extract valuable insights that lead to real results. Focus on the metrics that matter, take action on what you learn, and keep refining your approach over time. With the right analytics tools and the right mindset, you can unlock a level of understanding about your business that was simply not possible before.
Start today. Pick one analytics tool, set up your tracking, and look at your data with fresh eyes. You might be surprised by what you discover. And once you see the power of data insights in action, you will wonder how you ever made decisions without them.
Frequently Asked Questions
What are the most important insights analytics tools can provide?
Analytics tools can reveal user behavior patterns, conversion rates, audience demographics, traffic sources, and engagement metrics. These insights help you understand your customers better and optimize your strategies for improved results.
Do I need to be a data expert to use analytics tools effectively?
Not at all. Most modern analytics platforms are designed with user-friendly interfaces and visual dashboards. You do not need advanced technical skills to extract meaningful data insights and make informed decisions for your business.
How often should I review my analytics data?
It depends on your goals and business type, but reviewing your performance metrics at least once a week is a solid practice. For active campaigns, daily checks can help you catch issues early and capitalize on opportunities quickly.
Can analytics tools help with marketing decisions?
Absolutely. Marketing analytics show you which channels drive the most traffic and conversions, allowing you to allocate your budget more effectively. You can see exactly which campaigns deliver the best return on investment.
What is the difference between descriptive and predictive analytics?
Descriptive analytics tells you what happened in the past, while predictive analytics uses historical data to forecast future outcomes. Both are valuable, but predictive analytics gives you a forward-looking advantage for planning and strategy.
Are free analytics tools worth using?
Yes, many free tools like Google Analytics offer powerful features that are more than enough for most small businesses. As your needs grow, you can explore paid options with advanced capabilities like real-time data and custom reporting.